Demystifying AI Strategy in Plain English: A Detective Story
Interested in exploring AI for your organization but feel overwhelmed by all the technical jargon? 🤔 You’re not alone.
This YouTube series is designed specifically for professionals without a technical background. Through a fun, fictional detective narrative, the video series breaks down complex AI concepts into simple, actionable insights that anyone can use.
Exploring Variations in Divvy Bike Stations' Usage Volumes
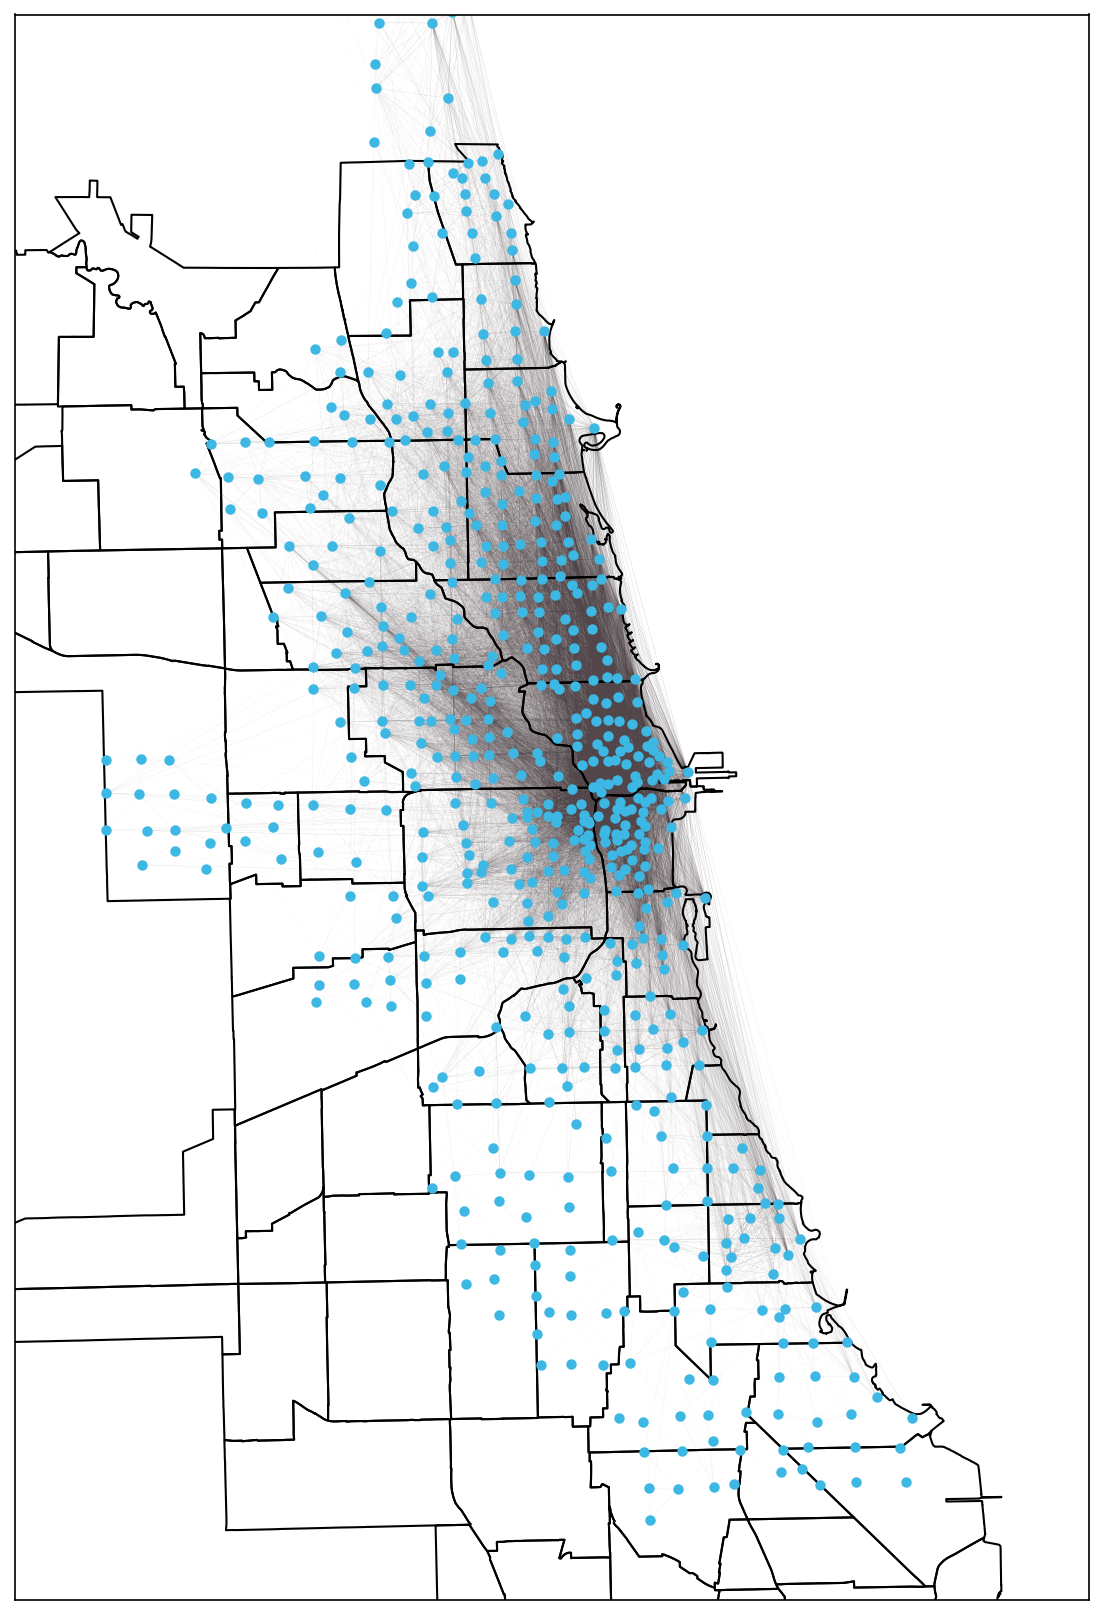
Launched in 2013, Divvy bikes is the largest public bike sharing service in Chicago. In April 2021, the most popular divvy bike station, Lake Shore Dr & Monroe St, was used for over 7 thousand times (for check-in and check-out). Meanwhile, three stations were only used once in the same month. What factors contribute to the variations in usage volume among divvy bike stations? This project compiled a station-level dataset from databases including Divvy historical trip records (April 2021), the City of Chicago Data Portal, US Census (2010), and Zillow Research to test six groups of hypotheses. Results show interesting associations between the usage volume of divvy bike stations and factors including network effects, crime rates, socio-economic status, and demography.
For more information, check out the blog post.
Network graph of Chicago Divvy bike stations and trips (April 2021)
CEO turnover and cultural change
Do CEO turnovers affect company culture? In this research project, I analyze the impact of CEO turnovers on employees' perception of company culture using Glassdoor company review data of 6 tech companies from 2008 to 2018. My hypothesis is that the three companies with CEO turnovers in the past decade (Apple, Google, Microsoft) experienced greater magnitude of cultural change than the three companies without CEO turnovers (Amazon, Facebook, Netflix). To test this hypothesis, I employed four different analysis methods on each company:
The analyses rejected my initial hypothesis that Apple, Google, Microsoft experienced greater magnitude of cultural changes than Amazon, Facebook, Netflix. I suspect that many other factors (change in sizes, strategic direction, industry trend, etc) also have impact on company culture.
For the next step, this project will expand its sample size to 1000+ companies and work with more data sources (statista, pitchbook, etc) to explore other causes and effects of company culture. Stay tuned.
Network Visualization of The Office (US) Characters
Recently, I found The Office (US) transcript dataset from Kaggle, which enables to explore the network relationships among The Office characters throughout the 9 seasons. The following graph shows the network of The Office characters with at least 500 scene interactions. Each point (node) represents a character. Each line (edge) between two nodes indicates that the two characters have appeared in the same scene. The width of the edge presents the number of scenes that the two characters share. The graph applies force-directed graph drawing, which means that characters who have more shared scenes with various other characters (greater centrality) are more likely to appear at the center of the graph.
For more information and season breakdown, check out the blog post.
Predicting Employee Attrition
In this Kaggle project, my goal is to predict employee attrition on IBM HR Analytics dataset (1470 rows, 79 variables). I employed several classification methods including logistic regression, Naïve Bayes, Decision Tree, K-nearest neighbors, Random Forest, Radial Support Vector Machines. I also experimented with several ensemble methods including Voting Classifier, Bagged Decision Tree, Adaptive Boosting, Gradient Boosting, and XGBoost.
The following graph shows the relative prediction performance of these methods. XGBoost achieves the highest score of 0.876. In feature importance analysis, I found that income, whether work overtime, stock option level, and levels of environment satisfaction are the most important factors associated with employee attrition.
Speaker Recognition System
As my final project for the Python Programming Course at UChicago, I built a speech recognition program using Markov models. Given 3 text files (Obama_speech.txt, Romney_speech.txt, unknown_speech.txt, for example), the speech recognition program is able to predict whether the first or the second speaker is more likely to be the author of the unknown speech.
While developing the program, I experimented with both hashtables and dictionary as data structures to store the trained Markov models. The following graph shows the relative performance of the two data structures.
Blackjack Game
In another project for the Python Programming Course at UChicago, I created a blackjack game. Try it out yourself: